
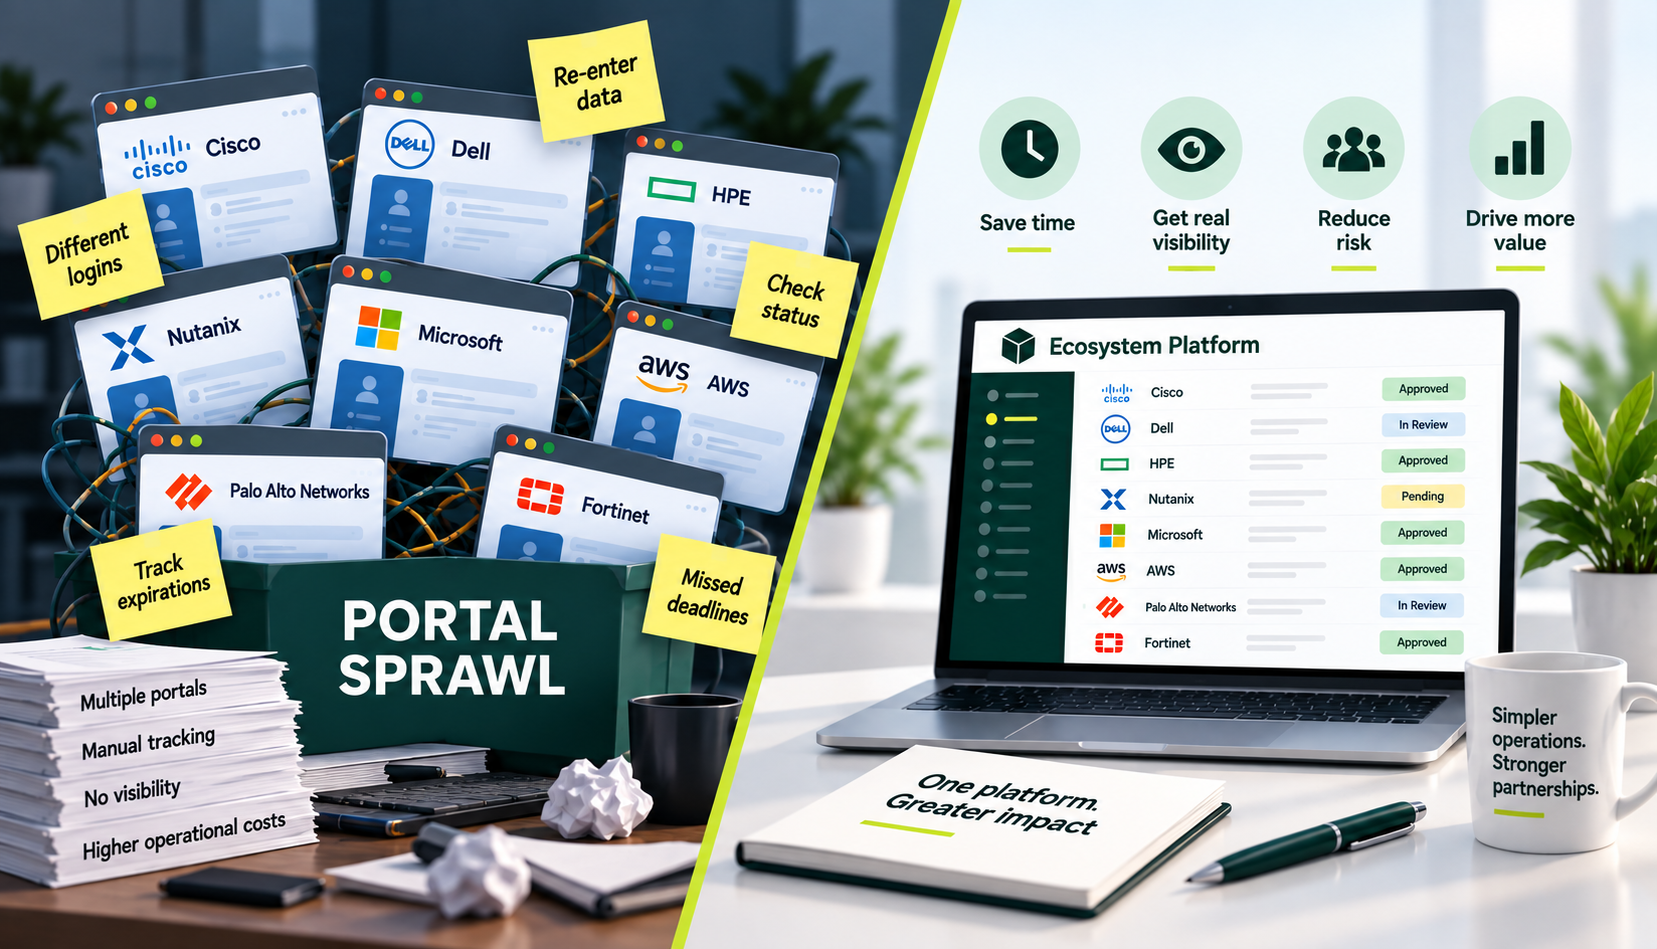
Most organizations can count their vendor portals. Far fewer can quantify how many hours those portals consume through status checks, duplicate data entry, approval follow-ups, and manual reconciliation.
That is where portal sprawl becomes more than an inconvenience. The portal count is visible; the labor cost is buried in people’s calendars, handoffs, and missed follow-ups.
This article explains how portal sprawl develops, why it creates operational risk, and how to calculate the hidden cost it adds to partner operations.
What Is Portal Sprawl
Portal sprawl is the buildup of separate, disconnected vendor portals that partner teams must log into, monitor, and manually reconcile to manage deal registrations, approvals, incentives, and other partner activity.
The problem is not usually one bad portal. It is the cumulative burden of many disconnected systems that each require attention, context, and follow-through.
How Portal Sprawl Happens
Portal sprawl rarely happens through one large decision. It builds gradually as each new vendor relationship introduces another required system, workflow, login, and set of rules.
The pattern is simple: one strategic vendor adds one portal; growth adds more vendors; each vendor brings its own process; and over time, the team inherits a fragmented operating model.
Each addition made sense in isolation. Nobody stepped back and asked what the cumulative system would look like.
The most common accelerants include:
- A new vendor relationship, each with its own mandatory portal
- M&A, which usually means inheriting someone else’s portal stack along with the deal
- Different partner programs requiring different registration and certification workflows
- Teams solving today’s problem (get this deal registered) without weighing the compounding cost of tomorrow’s
Individually, each decision may be reasonable. Collectively, they create a system that no one intentionally designed and few teams actively manage.
What Portal Sprawl Looks Like in Practice
In practice, portal sprawl often looks harmless because the work arrives in small increments: one status check, one approval follow-up, one copied update, one missed notification.
A partner operations manager may check Vendor A for registration status, Vendor B for approval updates, and Vendor C for incentive details. Because those systems do not automatically sync with each other or with the CRM, the same information often has to be copied into internal trackers by hand.
As the vendor list grows, this workaround becomes the operating model. Manual coordination becomes normal, and one person often becomes the unofficial expert in how every portal works.
The Portal Jockey Problem
The portal jockey is the person everyone relies on to keep fragmented vendor systems moving. They know which portal times out quickly, which one works best in a specific browser, and where approvals are hidden.
Over time, the team stops treating that knowledge as a workaround and starts depending on it as a process.
That dependency is risky because it turns a skilled operator into a human bridge between systems that were never built to connect.
The role usually forms through small, reasonable requests:
- A rep asks “can you check the status on this”
- Checking requires knowing three different portal logins and quirks
- It becomes that person’s job by default, not by design
- Repeat weekly until it’s most of someone’s week
The issue is not that this person is helpful. The issue is that a high-value operator is spending hours on coordination work that should be visible, repeatable, and shared.
A simple illustrative model shows how quickly the time adds up:
- 45 minutes a day lost to fragmented portal work
- = 3.75 hours a week
- = roughly 195 hours a year
- = nearly five full work weeks a year, per person
That number matters because it is only the per-person baseline. Once the same pattern spreads across a team, the cost grows quickly.
The Hidden Costs of Portal Sprawl
The cost of portal sprawl is not one line item. It shows up across several operational categories, and those costs compound over time.
| Cost Category | What It Actually Looks Like |
|---|---|
| Switching & re-entry | Logging in and out of multiple systems, re-keying the same deal data because nothing syncs |
| Monitoring | Someone has to proactively check status, since most portals don’t push notifications reliably |
| Missed deadlines & follow-ups | Expirations and status changes go unnoticed until it’s too late to act |
| Knowledge dependency | One person becomes the only one who knows how a given vendor’s portal actually works |
None of these show up as a budget line. They show up as headcount, spread across people’s days in increments too small for anyone to add up, until you actually try.
PTO Blindness: A Single Point of Failure
Portal sprawl also creates a form of operational risk that often goes unnoticed until someone is out of office.
A deal can expire while the usual owner is away simply because no one else knew which portal to check, what was pending, or how to act on it.
Call it PTO blindness: the workflow, login habits, deadlines, and portal knowledge live with one person instead of in a shared, visible process.
It’s not really a vacation problem. It’s a single point of failure that happens to have a calendar invite attached.
A few things tend to break down at once when this happens:
- Key-person dependency — one employee, one vendor relationship, no backup
- Lost institutional visibility — nobody else can see what’s pending, let alone act on it
- Delayed action — deadlines pass quietly instead of getting flagged
- Coverage gaps — a normal PTO week becomes an operational risk week
And this doesn’t stay flat as you grow. Each new vendor means someone new has to learn that portal, remember its quirks, and become the one person who can operate it. More vendors means more of these gaps, not fewer.
The uncomfortable part: the bigger your partner ecosystem gets, the more fragile this setup becomes. That’s not what scalable is supposed to look like.
What Portal Sprawl Actually Costs
You’ve already seen the individual number: roughly 195 hours a year per person. Now scale it to a team, same illustrative logic, scaled up:
5 employees × 3.75 hours/week × 48 working weeks × $50/hour loaded cost ≈ $45,000 a year
That estimate does not include missed expirations, delayed follow-ups, or lost pipeline. The exact number will vary by headcount, vendor count, and loaded labor cost. The larger point is that most teams have not run the calculation at all, because the cost is scattered across people’s days instead of appearing as a single budget line.
Missed expirations and delayed follow-ups aren’t just annoying on top of that. They’re lost or discounted pipeline. Fragmented visibility delays awareness, delayed awareness delays action, and delayed action is how opportunities get missed. You don’t need an industry statistic to know that chain is real. You’ve probably watched it happen.
Can You Eliminate Portal Sprawl
Probably not entirely, and that’s not actually the goal.
Some vendor-owned portals will always exist. You’re not going to convince every vendor in your ecosystem to abandon their own system.
The goal isn’t zero portals. It’s removing the human labor tax required to operate across them, so a growing vendor list adds pipeline opportunity without adding proportional headcount risk.
What Scalable Partner Operations Require
A few principles hold regardless of your specific vendor stack:
- Consolidate the system of engagement, even where you can’t consolidate the system of record
- Standardize the workflow instead of adapting your process to each vendor’s portal
- Treat one login regardless of vendor count as an operating requirement, not a nice-to-have
- Design for the person who isn’t the portal jockey. If only one person can operate a given vendor relationship, that’s a finding, not a fact of life
None of this requires more portals. It requires making labor that’s currently invisible, and buried inside headcount, visible enough to actually manage.
The Fix Is Not Another Portal
Adding another standalone system to solve a problem caused by too many standalone systems only relocates the labor tax. It does not remove it.
Vartopia gives partners one shared system of engagement across 300+ vendor relationships. Instead of asking teams to learn one more portal, it centralizes the work partners are already doing across vendor ecosystems. One system, not one more portal to learn.
That shared workflow reduces PTO blindness because coverage no longer depends on one person’s portal habits. In addition, it also changes the economics of vendor growth: adding the 20th vendor relationship should not add the same manual burden as the first. That’s the shift worth testing before you look at anything else.
Final Thoughts
Portal count was never the metric that mattered. Labor per vendor is. That distinction is easy to miss because portal count is the thing you can see and count on a whiteboard, while labor per vendor lives in calendars, handoffs, and the quiet accumulation of someone’s Tuesday afternoon.
It’s not tracked anywhere, so it doesn’t get managed anywhere, even though it’s usually the bigger number. That’s the question worth carrying out of this article and into your own vendor list: as it grows, does the labor grow with it, or does it stay flat? The answer tells you whether you’re scaling a partner ecosystem or just accumulating portals.

Request a demo and see what your team could do with one login instead of five.